Remove a school to add this one - Manage Schools
Remove a school to add this one - Manage Schools
Remove a district to add this one - Manage Districts
Remove a district to add this one - Manage Districts


These models require schools to have a minimum of ten students in each indicator to be eligible to earn the points. Schools that do not meet the minimum student threshold cannot earn points for that indicator.
| Component | Weight | Description | ||||||||||
|---|---|---|---|---|---|---|---|---|---|---|---|---|
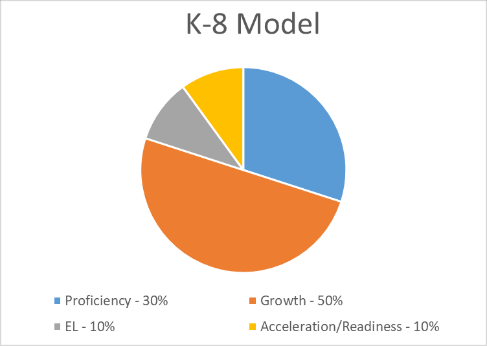
| Proficiency | 30% | Arizona State Assessment and Alternative Assessment in both English Language Arts and Math. | ||||||||||
| Growth | 50% |
Student Growth Percentiles: English Language Arts and Math Students' performance in the 2018-2019 school year and their growth in the 2020-2021 school year compared to their academic peers. |
||||||||||
| EL | 10% |
Proficiency on English Learner Assessment:
School's percentage of students proficient compared to the average K-8 EL proficiency. Growth on English Learner Assessment: School’s change in performance levels compared to the average K-8 change in performance levels the current year. |
||||||||||
| Acceleration/Readiness (Reported as one score) | 10% |
Grade 8 AzM2 Math:
Increases in students scoring highly proficient on the state Math assessment or 60% or more of Grade 8 students score Highly Proficient Decreases in students scoring minimally proficient on the state Math assessment or 10% or less of Grade 8 students score minimally proficient Grade 3 English Language Arts: Decreases the school’s 2020-2021minimally proficient percentage compared to 2018-2019 percentage or maintains a low minimally proficient percentage. Chronic Absenteeism: Decreases in the school’s 2020-2021, chronic absenteeism percentage compared to 2019-2020 or maintains a low chronic absenteeism rate. Inclusion of Special Education Students in General Education: Has a higher percent of mainstreamed special education students in a general education classroom than the state average. Improved Proficiency of Subgroups: Improvement in the school's subgroup scores in 2020-2021 compared to 2018-2019 for those subgroups. |
||||||||||
| Science Bonus | 3pts | Based on the participation on the State Science Assessment, schools may earn 1.5 points for testing 90% of their eligible students, or 3.0 points for testing 95% of their students. | ||||||||||
| SPED Bonus | 2pts |
Schools earn SPED Bonus points based on the percent of full academic year students enrolled in special education compared to the statewide average.
|
| Component | Weight | Description | ||||||||||
|---|---|---|---|---|---|---|---|---|---|---|---|---|
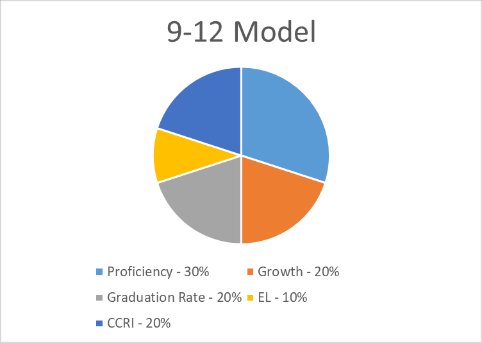
| Proficiency | 30% | Arizona State Assessment and Alternative Assessment in both English Language Arts and Math. | ||||||||||
| Growth | 20% | Student Growth Percentiles: English Language Arts and Math Students' performance in the 2018-2019 school year and their growth in the 2020-2021 school year compared to their academic peers. | ||||||||||
| Graduation Rate (Reported as one score) | 20% |
4, 5, 6, and 7-Year Grad Rate:
Graduation rate is calculated based on the 4, 5, 6, and 7-Year rates on a tiered weighting system for half of the graduation points.
Improvement Calculation: School’s improvement over the prior year’s graduation rate. |
||||||||||
| EL | 10% |
Proficiency on English Learner Assessment:
School’s percentage of students proficient compared to the average 9-12 EL Proficiency.
Growth on English Learner Assessment: School’s change in performance levels compared to the average 9-12 change in performance levels in the current year. |
||||||||||
| College and Career Readiness (Reported as one score and self-reported by the school) | 20% | College and Career Readiness points are determined by average points from current year’s seniors’ achievement and accomplishment in a matrix of various categories, from successful completion of a Career and Technical Education Program to performance on Advanced Placement Exams. More information regarding what is included can be found by following the link shown below to visit the Arizona State Board of Education website. | ||||||||||
| Science Bonus | 3pts | Based on the participation on the State Science Assessment, schools may earn 1.5 points for testing 90% of their eligible students, or 3.0 points for testing 95% of their students. | ||||||||||
| SPED Bonus | 2pts |
Schools earn SPED Bonus points based on the percent of full academic year students enrolled in special education compared to the statewide average.
|
| Component | Weight | Description |
|---|---|---|
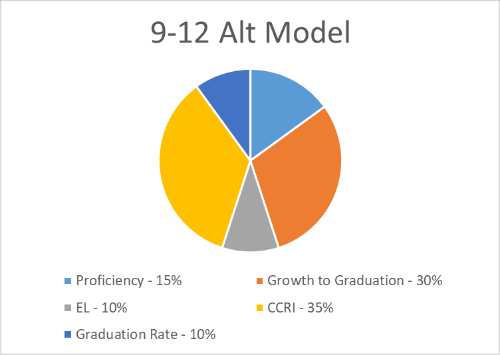
| Proficiency | 15% | Arizona State Assessment and Alternative Assessment in both English Language Arts and Math. |
| Growth to Graduation | 30% |
Academic Persistence:
Calculated based on the percent of students who finished the prior school year at the school and had a subsequent enrollment at an Arizona public school by October 1 of the following year.
Credits Earned: Schools self-report the percent of students who are continuously enrolled for at least eighty school days who earned 4.5 or more credits. On-Track to Graduate: Schools self-report the percent of students who are within three credits of meeting Arizona State Board of Education graduation requirements as of January 31, who graduate by the end of the fiscal year. |
| EL | 10% |
Proficiency on English Learner Assessment:
School’s percentage of students proficient compared to the average 9-12 EL Proficiency.
Growth on English Learner Assessment: School’s change in performance levels compared to the average 9-12 change in performance levels in the current year. |
| Alternative CCRI (College and Career Readiness Indicator as self-reported by the school) | 35% | College and Career Readiness points are determined by average points from current year’s seniors’ achievement and accomplishment in a matrix of various categories, from successful completion of a Career and Technical Education Program to performance on Advanced Placement Exams. More information regarding what is included can be found by following the link shown below to visit the Arizona State Board of Education website. |
| Graduation Rate (Reported as one score) | 10% | Best of 4, 5, 6, and 7-Year Grad Rate: Graduation rate is calculated based on the 4, 5, 6, and 7-Year rates and schools earn points based on whichever graduation rate is highest. |
| Graduation Rate Bonus | 6pts | Schools earn two points per subgroups for having greater than the statewide average graduation rate for the McKinney-Vento (Homeless) Cohort subgroup, Foster Care Cohort subgroup, and/or Special Education Cohort subgroup. |
For more information regarding Arizona’s A-F Accountability System, please visit the Arizona State Board of Education Accountability Website by clicking here.
Schools that serve grades K-12, 1-12, 2-12, 3-12, 4-12, 6-11, etc. utilize both the K-8 and 9-12 models. The two models are calculated independently. The students in grades K-8 are used to determine the K-8 total points earned and students in grades 9-12 determine the 9-12 total points earned. Total points for hybrid schools are calculated using a weighted average. The weighted average is based on the students enrolled in the K-8 and 9-12 models at the start of the spring testing window.