Remove a school to add this one - Manage Schools
Remove a school to add this one - Manage Schools
Remove a district to add this one - Manage Districts
Remove a district to add this one - Manage Districts


The Federal Every Student Succeeds Act (ESSA) requires states to identify schools for Comprehensive Support and Improvement (CSI) for overall low student achievement and low graduation rate, Additional Targeted Support and Improvement Schools (ATSI) for low subgroup achievement, and Targeted Support and Improvement (TSI) for schools with consistently underperforming subgroups.
These models require schools to have a minimum of twenty students in each indicator to be eligible to earn the points. Schools that do not meet the minimum student threshold cannot earn points for that indicator.
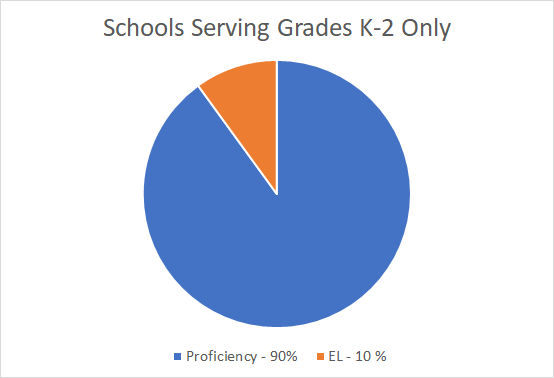
| Component | Weight | Description |
|---|---|---|
| Proficiency | 90% | Arizona State Assessment and Alternative Assessment in both English Language Arts and Math. |
| EL | 10% |
Proficiency on English Learner Assessment: School's percentage of students proficient compared to the average K-8 EL Proficiency. Growth on English Learner Assessment: School's change in performance levels compared to the average K-8 change in performance levels in the current year. |
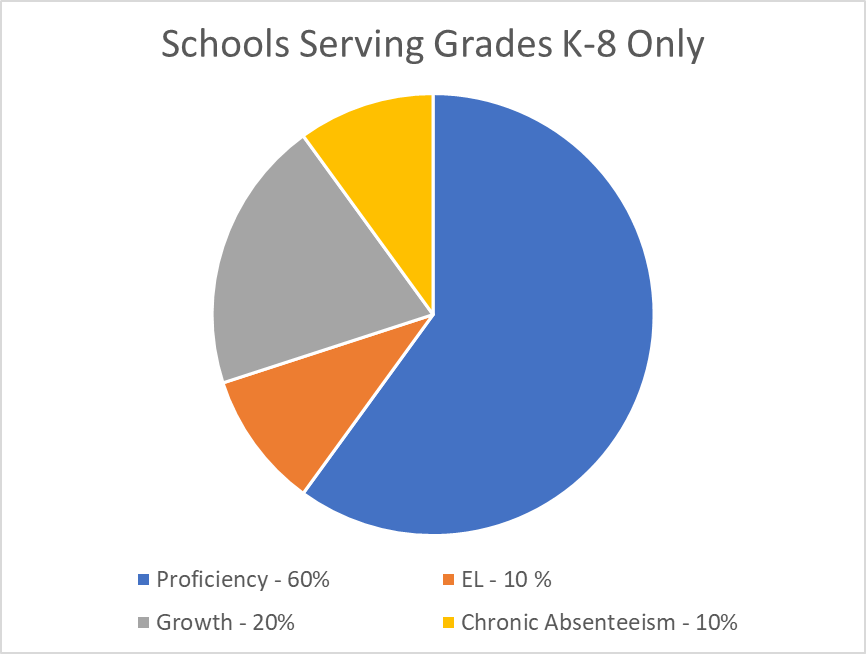
| Component | Weight | Description |
|---|---|---|
| Proficiency | 60% | Arizona State Assessment and Alternative Assessment in both English Language Arts and Math. |
| EL | 10% |
Proficiency on English Learner Assessment: School's percentage of students proficient compared to the average K-8 EL Proficiency. Growth on English Learner Assessment: School's change in performance levels compared to the average K-8 change in performance levels in the current year. |
| Growth | 20% |
Student Growth Percentiles: English Language Arts and Math Students' performance in the 2018-2019 school year and their growth in the 2020-2021 school year compared to their academic peers. |
| Chronic Absenteeism | 10% | Percent of Students who did not miss more than 18 days in the current school year. |
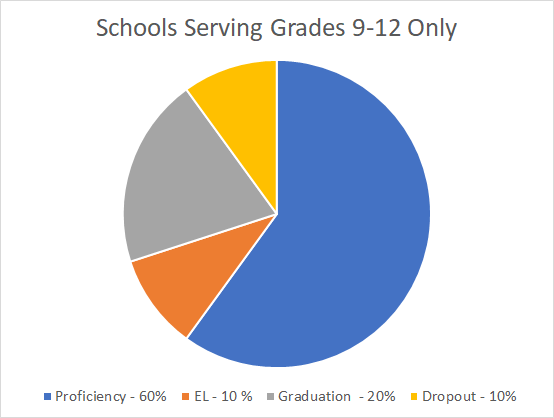
| Component | Weight | Description |
|---|---|---|
| Proficiency | 60% | Arizona State Assessment and Alternative Assessment in both English Language Arts and Math. |
| EL | 10% |
Proficiency on English Learner Assessment: School's percentage of students proficient compared to the average 9-12 EL Proficiency. Growth on English Learner Assessment: School's change in performance levels compared to the average 9-12 change in performance levels in the current year. |
| Graduation Rate | 20% | Percent of students from a school's 4-year graduating cohort that graduated. In the 2020-2021 school year the graduation rate for federal accountability was based on Cohort 2020. |
| Dropout | 10% | Percent of Students who did not drop out during the school year. |
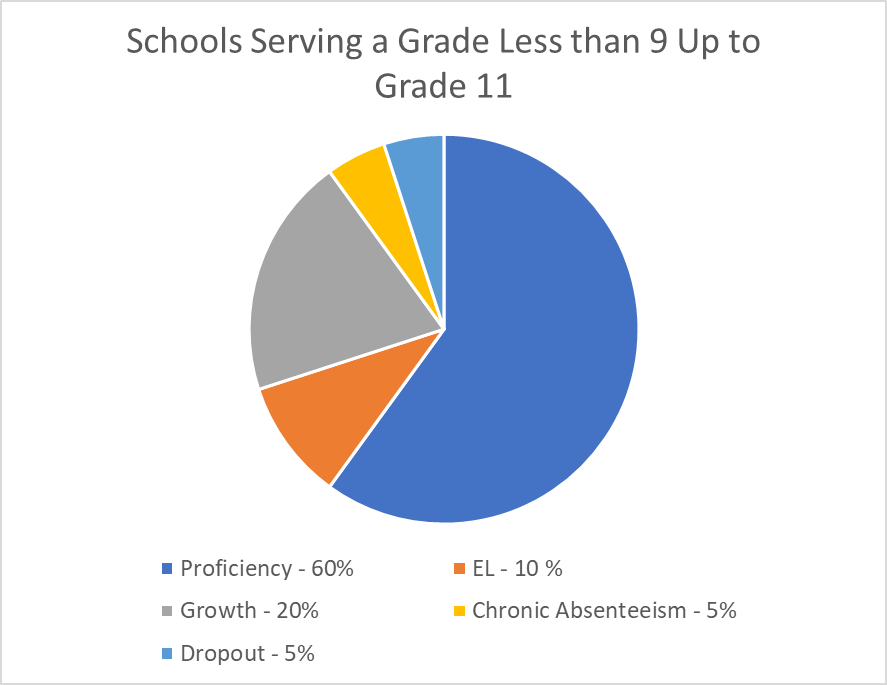
| Component | Weight | Description |
|---|---|---|
| Proficiency | 60% | Arizona State Assessment and Alternative Assessment in both English Language Arts and Math. |
| EL | 10% |
Proficiency on English Learner Assessment: School's percentage of students proficient compared to the average K-8 and 9-12 EL Proficiency. Growth on English Learner Assessment: School's change in performance levels compared to the average K-8 and 9-12 change in performance levels in the current year. |
| Growth | 20% | Student Growth Percentiles: English Language Arts and Math Students' performance in the 2018-2019 school year and their growth in the 2020-2021 school year compared to their academic peers. |
| Chronic Absenteeism | 5% | Percent of Students who did not miss more than 18 days in the current school year. |
| Dropout | 5% | Percent of Students who did not drop out during the school year. |
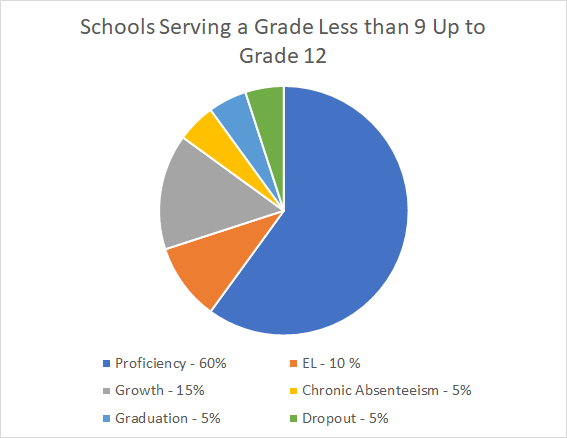
| Component | Weight | Description |
|---|---|---|
| Proficiency | 60% | Arizona State Assessment and Alternative Assessment in both English Language Arts and Math. |
| EL | 10% |
Proficiency on English Learner Assessment: School's percentage of students proficient compared to the average K-8 and 9-12 EL Proficiency. Growth on English Learner Assessment: School's change in performance levels compared to the average K-8 and 9-12 change in performance levels in the current year. |
| Growth | 15% | Student Growth Percentiles: English Language Arts and Math Students' performance in the 2018-2019 school year and their growth in the 2020-2021 school year compared to their academic peers. |
| Chronic Absenteeism | 5% | Percent of Students who did not miss more than 18 days during the school year. |
| Graduation | 5% | Percent of students from a school's 4-year graduating cohort that graduated. In the 2020-2021 school year the graduation rate for federal accountability was based on Cohort 2020. |
| Dropout | 5% | Percent of Students who did not drop out during the school year. |